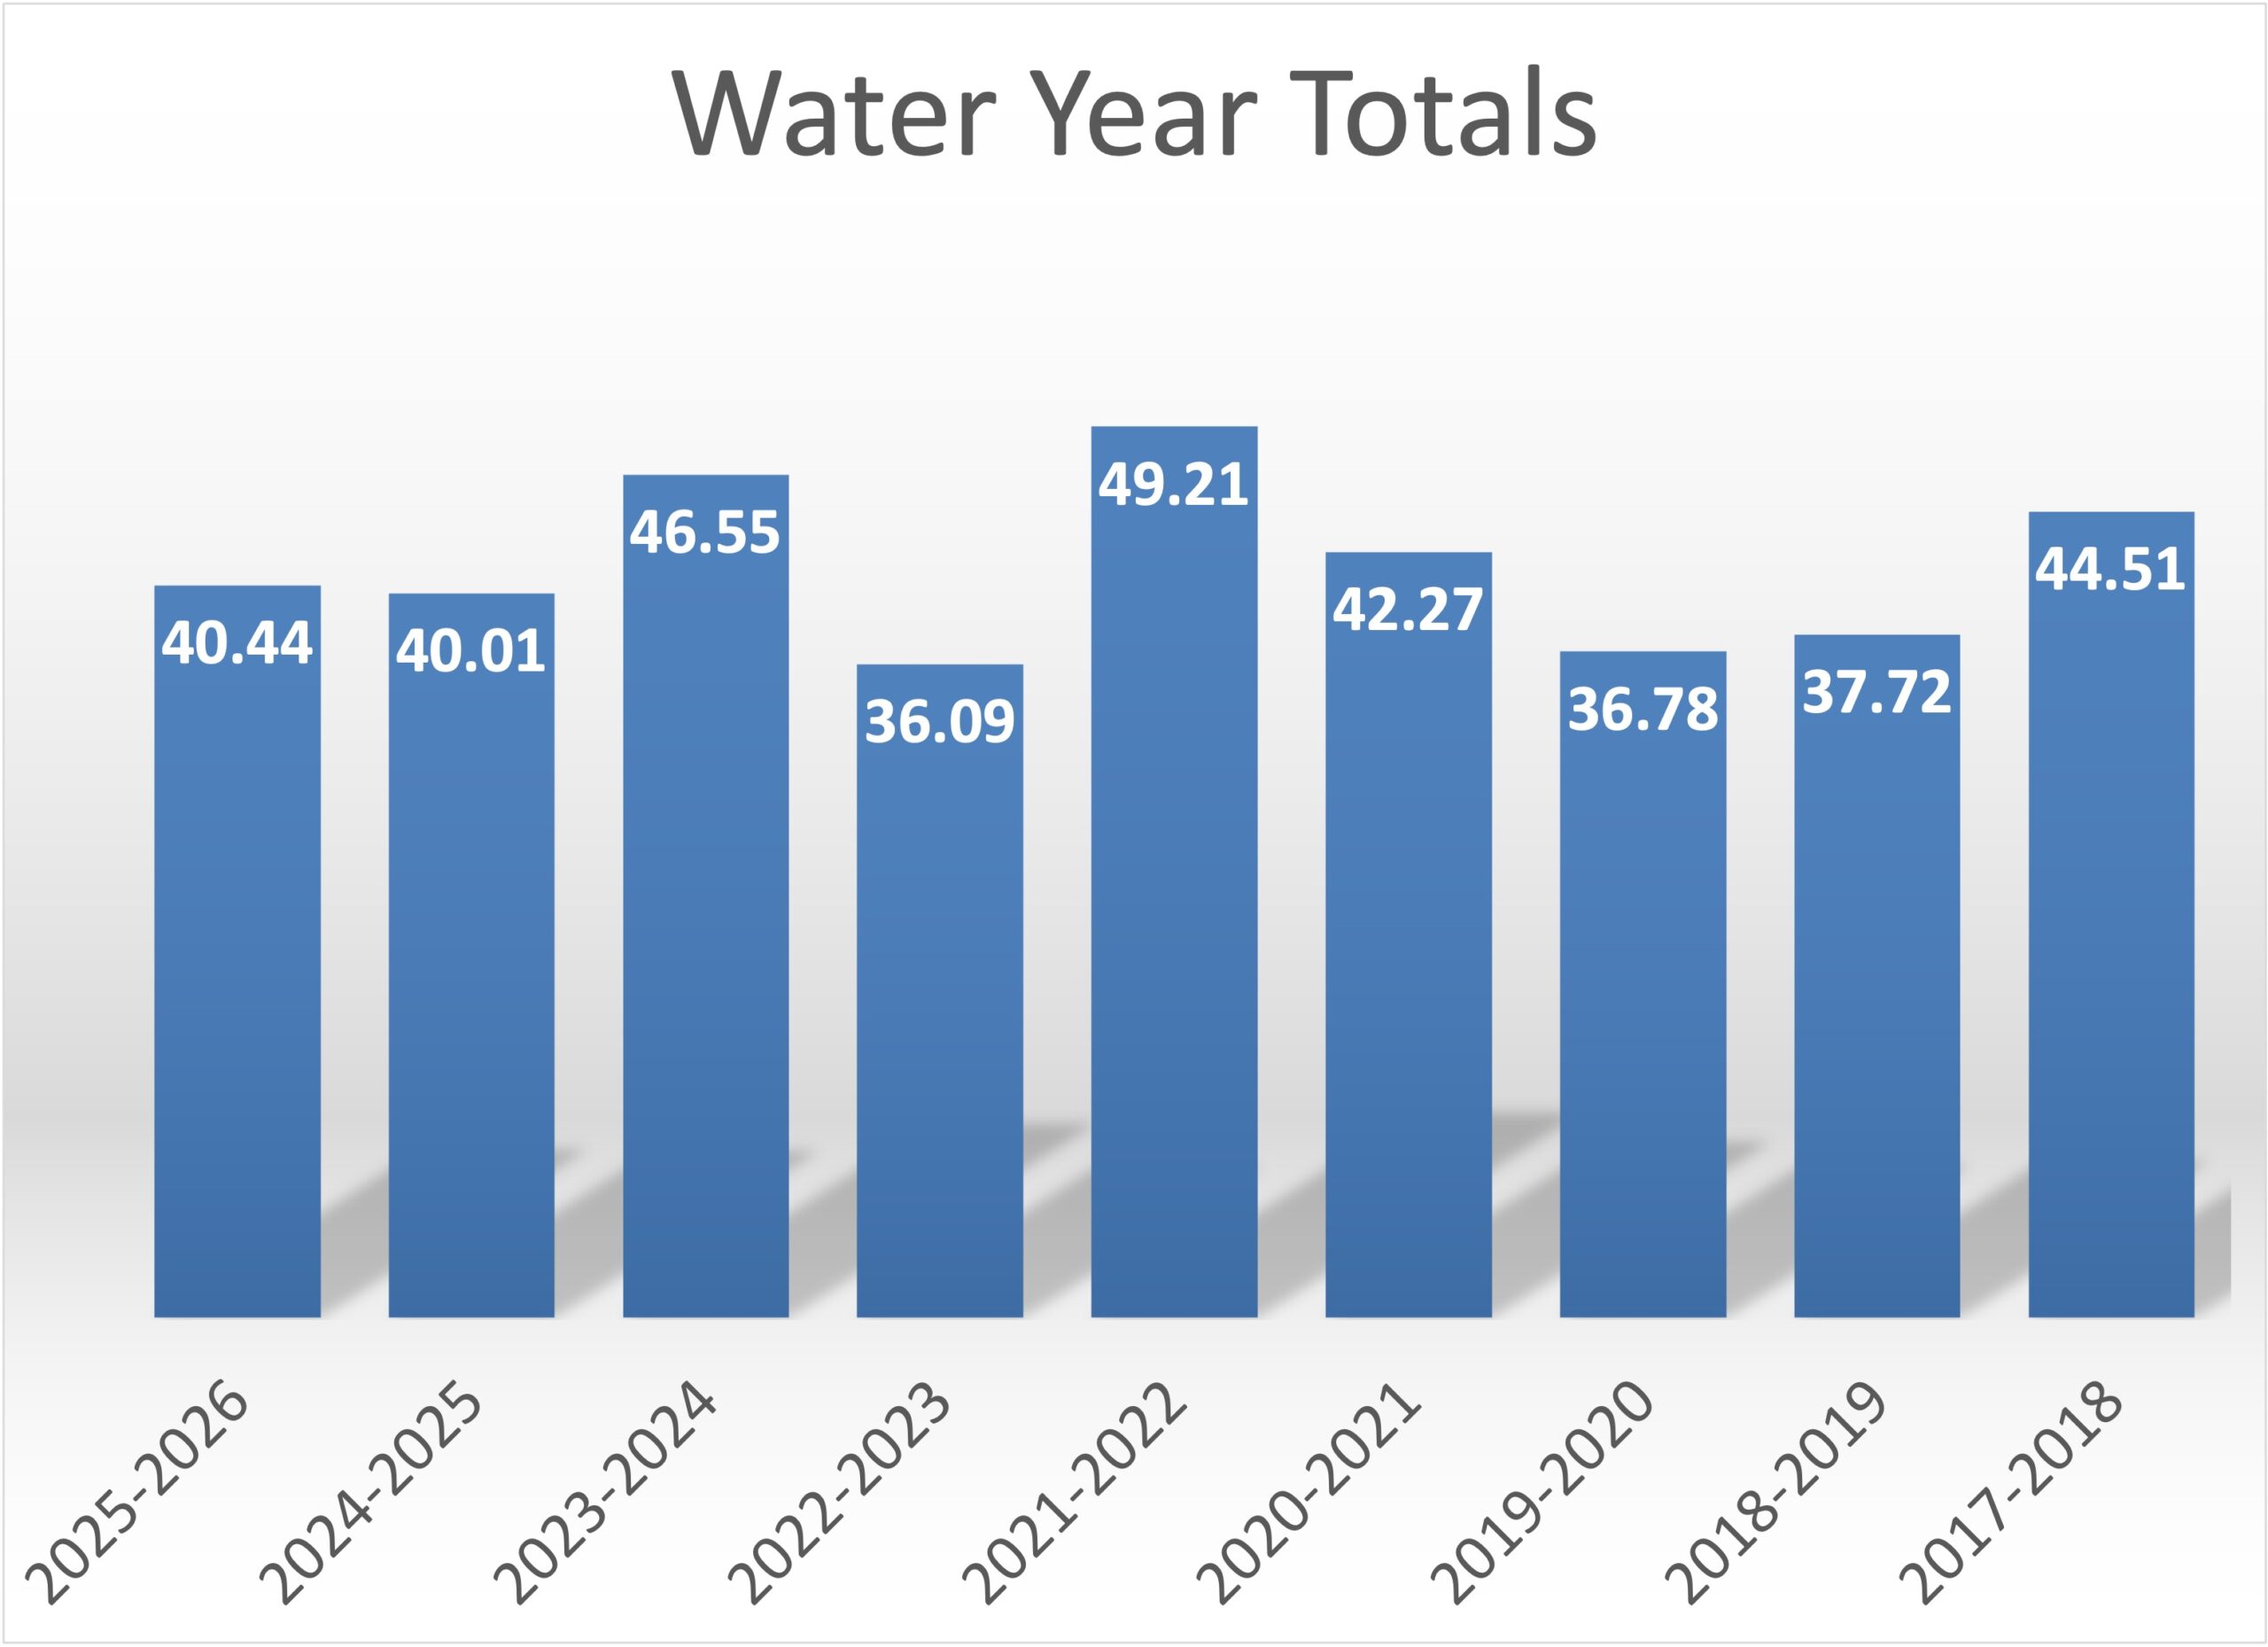
Water years are defined as precipitation (rain and snow water equivalent) that fall between October 1st and September 30th.
Updated: 03.14.2026
| Month | 2025-2026 Precip | 2025-2026 Snow | 2024-2025 Precip | 2024-2025 Snow | 2023-2024 Precip | 2023-2024 Snow | 2022-2023 Precip | 2022-2023 Snow | 2021-2022 Precip | 2021-2022 Snow | 2020-2021 Precip | 2020-2021 Snow | 2019-2020 Precip | 2019-2020 Snow | 2018-2019 Precip | 2018-2019 Snow | 2017-2018 Precip | 2017-2018 Snow |
|---|---|---|---|---|---|---|---|---|---|---|---|---|---|---|---|---|---|---|
| La Niña | Neutral | El Niño | La Niña | La Niña | La Niña | Neutral | El Niño | Neutral | ||||||||||
| Oct | 4.47 | 0.00 | 2.18 | 0.00 | 2.27 | 0.00 | 1.87 | 0.00 | 2.78 | 0.00 | 4.82 | 0.00 | 3.33 | 0.00 | 2.77 | 0.00 | 6.88 | 0.00 |
| Nov | 6.73 | 0.00 | 7.17 | 0.00 | 5.70 | 0.00 | 7.26 | 6.40 | 8.94 | 0.00 | 8.51 | 0.00 | 0.89 | 0.00 | 3.68 | 0.00 | 10.22 | 0.00 |
| Dec | 13.98 | 0.00 | 11.67 | 7.20 | 9.54 | 6.90 | 9.27 | 19.30 | 9.74 | 32.26 | 7.77 | 7.70 | 4.71 | 4.50 | 9.08 | 4.80 | 5.92 | 12.20 |
| Jan | 3.24 | 0.10 | 3.14 | 8.60 | 13.40 | 23.10 | 3.64 | 7.50 | 7.53 | 39.60 | 7.01 | 1.40 | 13.73 | 17.60 | 4.43 | 7.20 | 7.85 | 0.00 |
| Feb | 5.64 | 1.30 | 5.92 | 15.40 | 5.29 | 20.60 | 3.85 | 13.5 | 2.22 | 0.20 | 8.20 | 16.40 | 4.84 | 0.50 | 6.89 | 72.55 | 4.73 | 13.50 |
| Mar | 6.38 | 0.00 | 6.37 | 0.00 | 3.05 | 0.60 | 3.31 | 2.20 | 4.06 | 0.90 | 1.68 | 1.40 | 2.76 | 2.90 | 1.45 | 4.40 | 2.64 | 0.40 |
| Apr | 1.23 | 0.00 | 1.55 | 0.00 | 4.32 | 1.60 | 5.71 | 14.06 | 0.30 | 0.00 | 1.44 | 0.00 | 4.87 | 0.00 | 4.73 | 0.40 | ||
| May | 1.04 | 0.00 | 2.76 | 0.00 | 0.39 | 0.00 | 4.23 | 0.00 | 0.96 | 0.00 | 2.11 | 0.00 | 0.80 | 0.00 | 0.04 | 0.00 | ||
| Jun | 0.22 | 0.00 | 1.81 | 0.00 | 0.04 | 0.00 | 2.94 | 0.00 | 1.08 | 0.00 | 1.52 | 0.00 | 0.31 | 0.00 | 0.63 | 0.00 | ||
| Jul | 0.27 | 0.00 | 0.13 | 0.00 | 0.00 | 0.00 | 0.11 | 0.00 | 0.00 | 0.00 | 0.05 | 0.00 | 0.16 | 0.00 | 0.00 | 0.00 | ||
| Aug | 0.39 | 0.00 | 0.85 | 0.00 | 0.19 | 0.00 | 0.08 | 0.00 | 0.02 | 0.00 | 0.03 | 0.00 | 1.03 | 0.00 | 0.01 | 0.00 | ||
| Sep | 0.51 | 0.00 | 0.20 | 0.00 | 2.05 | 0.00 | 0.39 | 0.00 | 1.92 | 0.00 | 1.37 | 0.00 | 2.25 | 0.00 | 0.86 | 0.00 | ||
| Total | 40.44 | 1.40 | 40.01 | 31.20 | 46.55 | 51.20 | 36.09 | 50.50 | 49.21 | 84.16 | 42.27 | 26.90 | 36.78 | 25.50 | 37.72 | 88.95 | 44.51 | 26.50 |
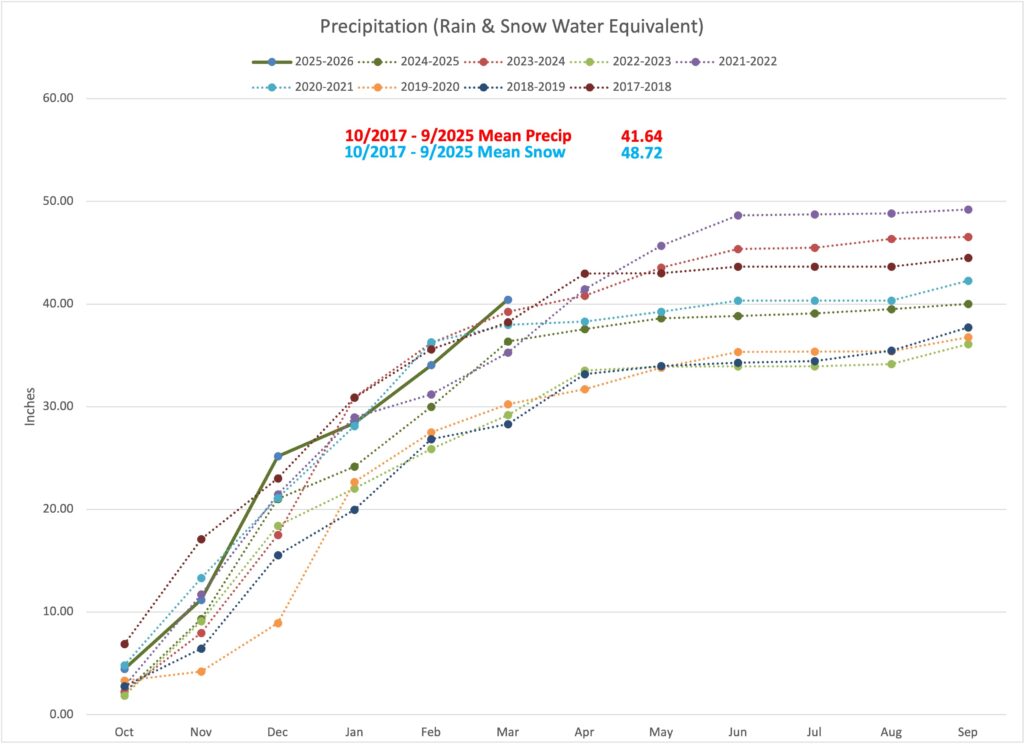
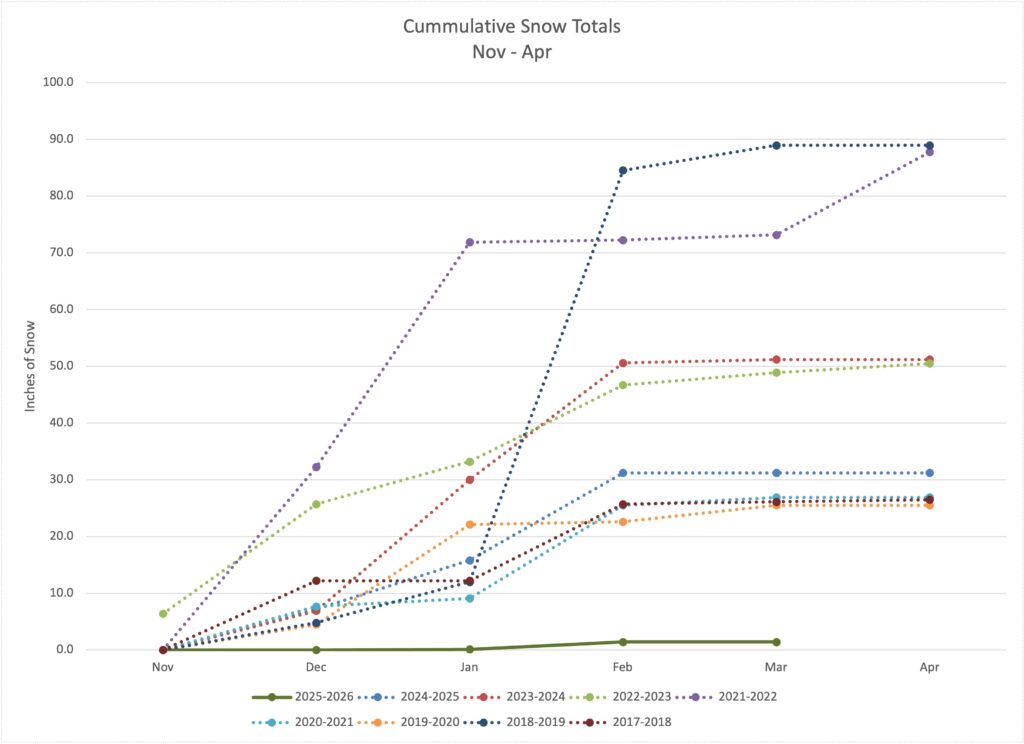
- Measurements are in inches
- Precip – total amount of rain and snow water equivalent (SWE) in inches
- Snow – total amount of new snow in inches
- ENSO – El Niño Southern Oscillation prominent during our winter months